Box Office Intelligence Dashboard
Exploratory data analysis of 50,000+ films to identify the key drivers of box office success — genre selection, budget optimisation, and critical reception — translated into a data-driven production strategy for a new movie studio.
Strategy Dashboard
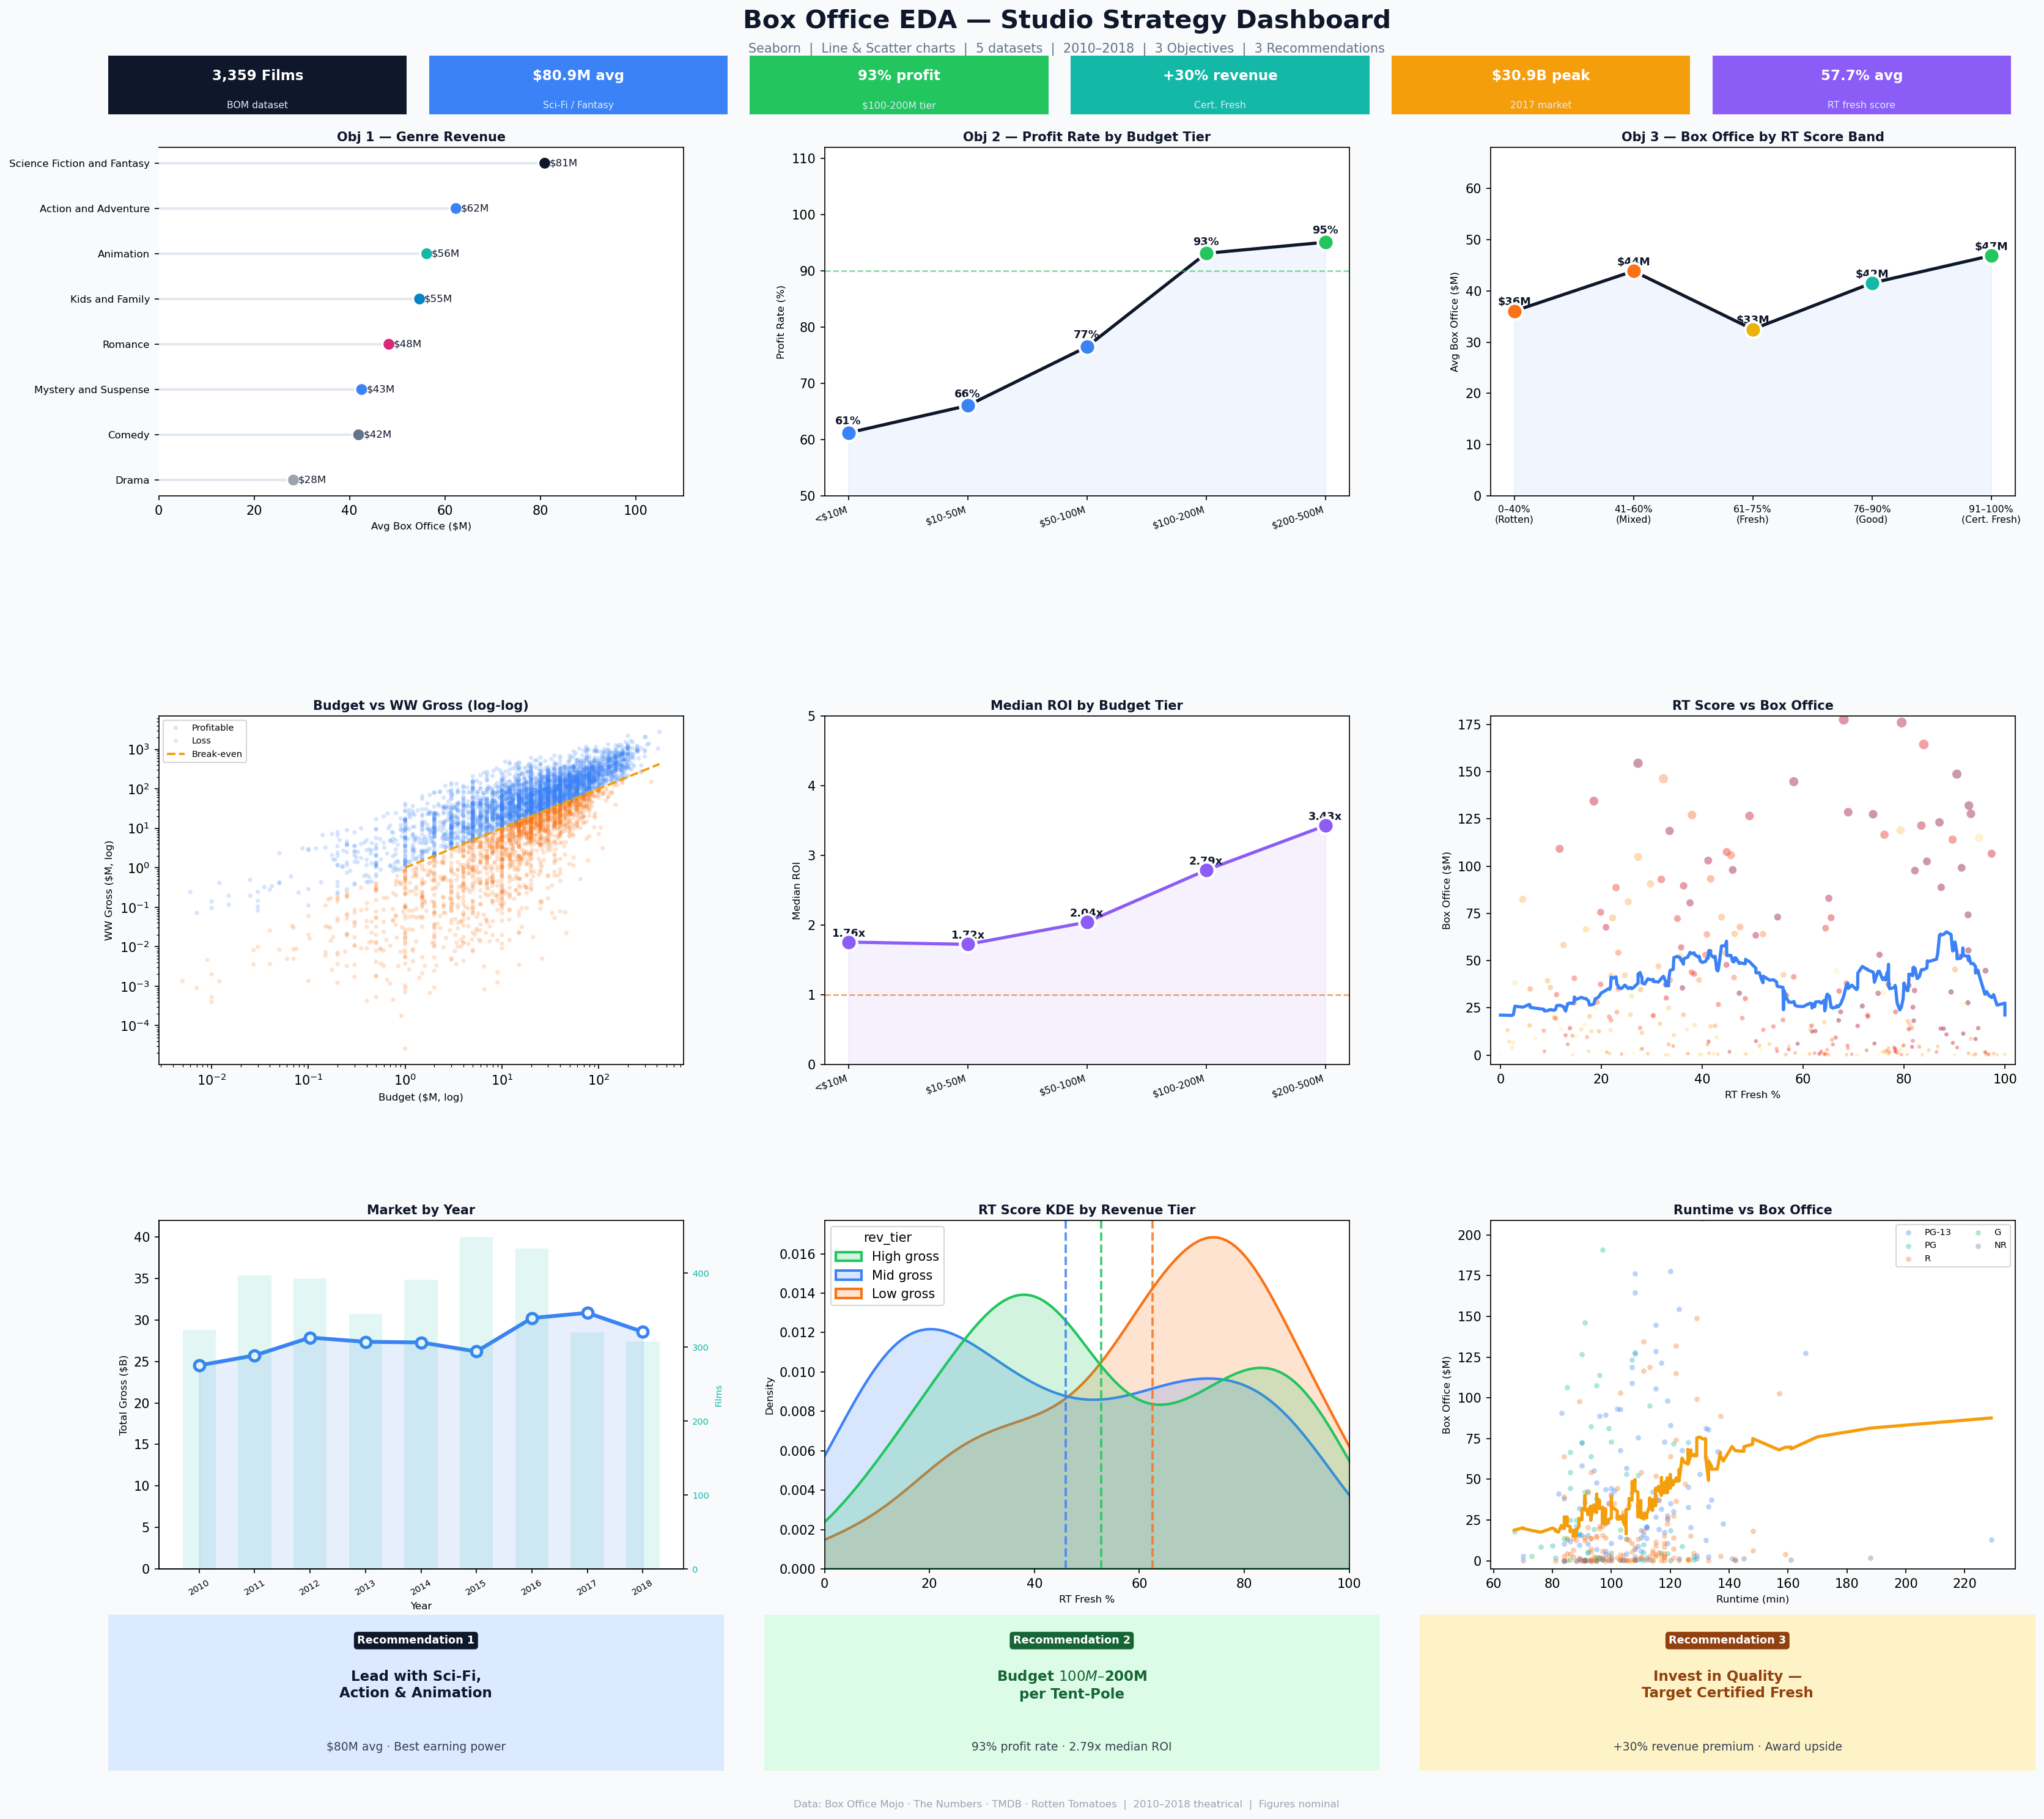
9-panel consolidated view for non-technical stakeholders — KPI headlines, objective summaries, diagnostic panels, market trends, and recommendation cards.
Business Context
Problem Statement
A company planning to enter the film industry lacks production experience and has no clear strategy for selecting the types of movies to produce. Given the high capital requirements and inherent risk of film production, the studio needs data-driven guidance to increase the likelihood of box office success from its first slate.
CRISP-DM Methodology
Data Sources
| Source | Records |
|---|---|
| Box Office Mojo | 3,387 |
| The Numbers | 5,782 |
| RT Movie Info | 1,560 |
| RT Reviews | 54,432 |
Analysis & Findings
Genre Revenue Analysis
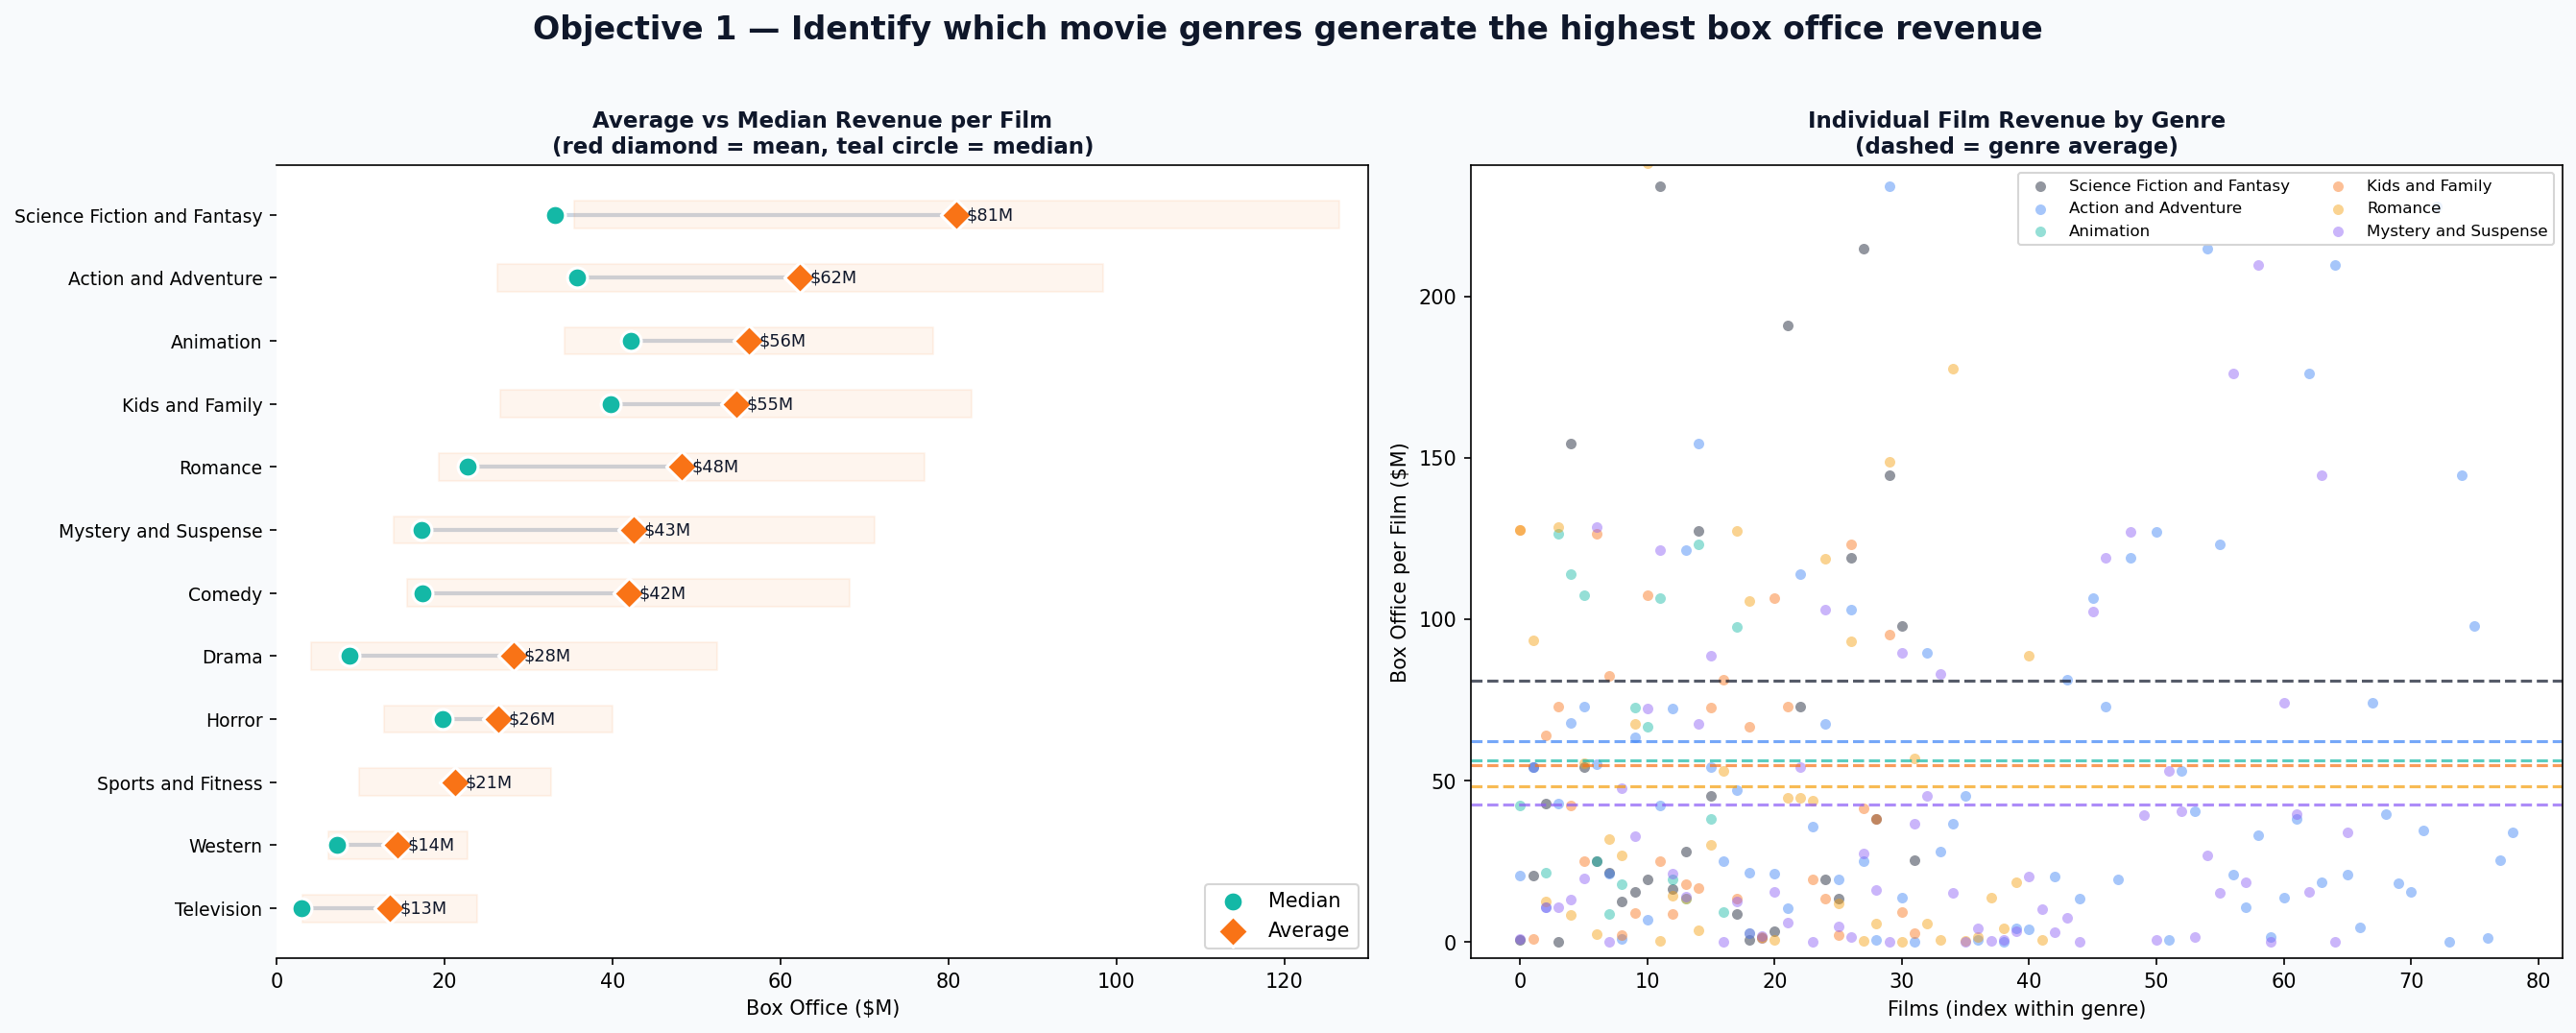
Identify which movie genres generate the highest box office revenue by exploding pipe-delimited genre tags, computing average and total gross per genre, and filtering to genres with ≥ 10 films to avoid small-sample bias.
Key Findings
- Sci-Fi / Fantasy leads at $80.9M average per film
- Action & Adventure: best volume-to-earnings ratio (366 films, $62.3M avg)
- Animation: most consistent — near-zero commercial failures in the dataset
- Comedy & Drama: high volume, low per-film avg ($41.9M / $28.3M) — inefficient for a new studio
- Horror: $26.4M avg but exceptional ROI potential at micro-budgets ($1–5M)
Code Sample
rt_genre = (
    rt_inf
    .assign(genre=rt_inf['genre']
        .fillna('Unknown')
        .str.split('|'))
    .explode('genre')
    .copy()
)
rt_genre['genre'] = rt_genre['genre'].str.strip()

genre_stats = (
    rt_genre
    .groupby('genre')['box_office']
    .agg(['mean','median','count','std'])
    .query('count >= 10')
    .sort_values('mean', ascending=False)
)
Key Insight — Genre is the single most controllable lever a new studio has. Sci-Fi, Action, and Animation deliver both earning power and consistency — the right combination for a studio that cannot afford high-profile failures early.
Budget vs. ROI Correlation
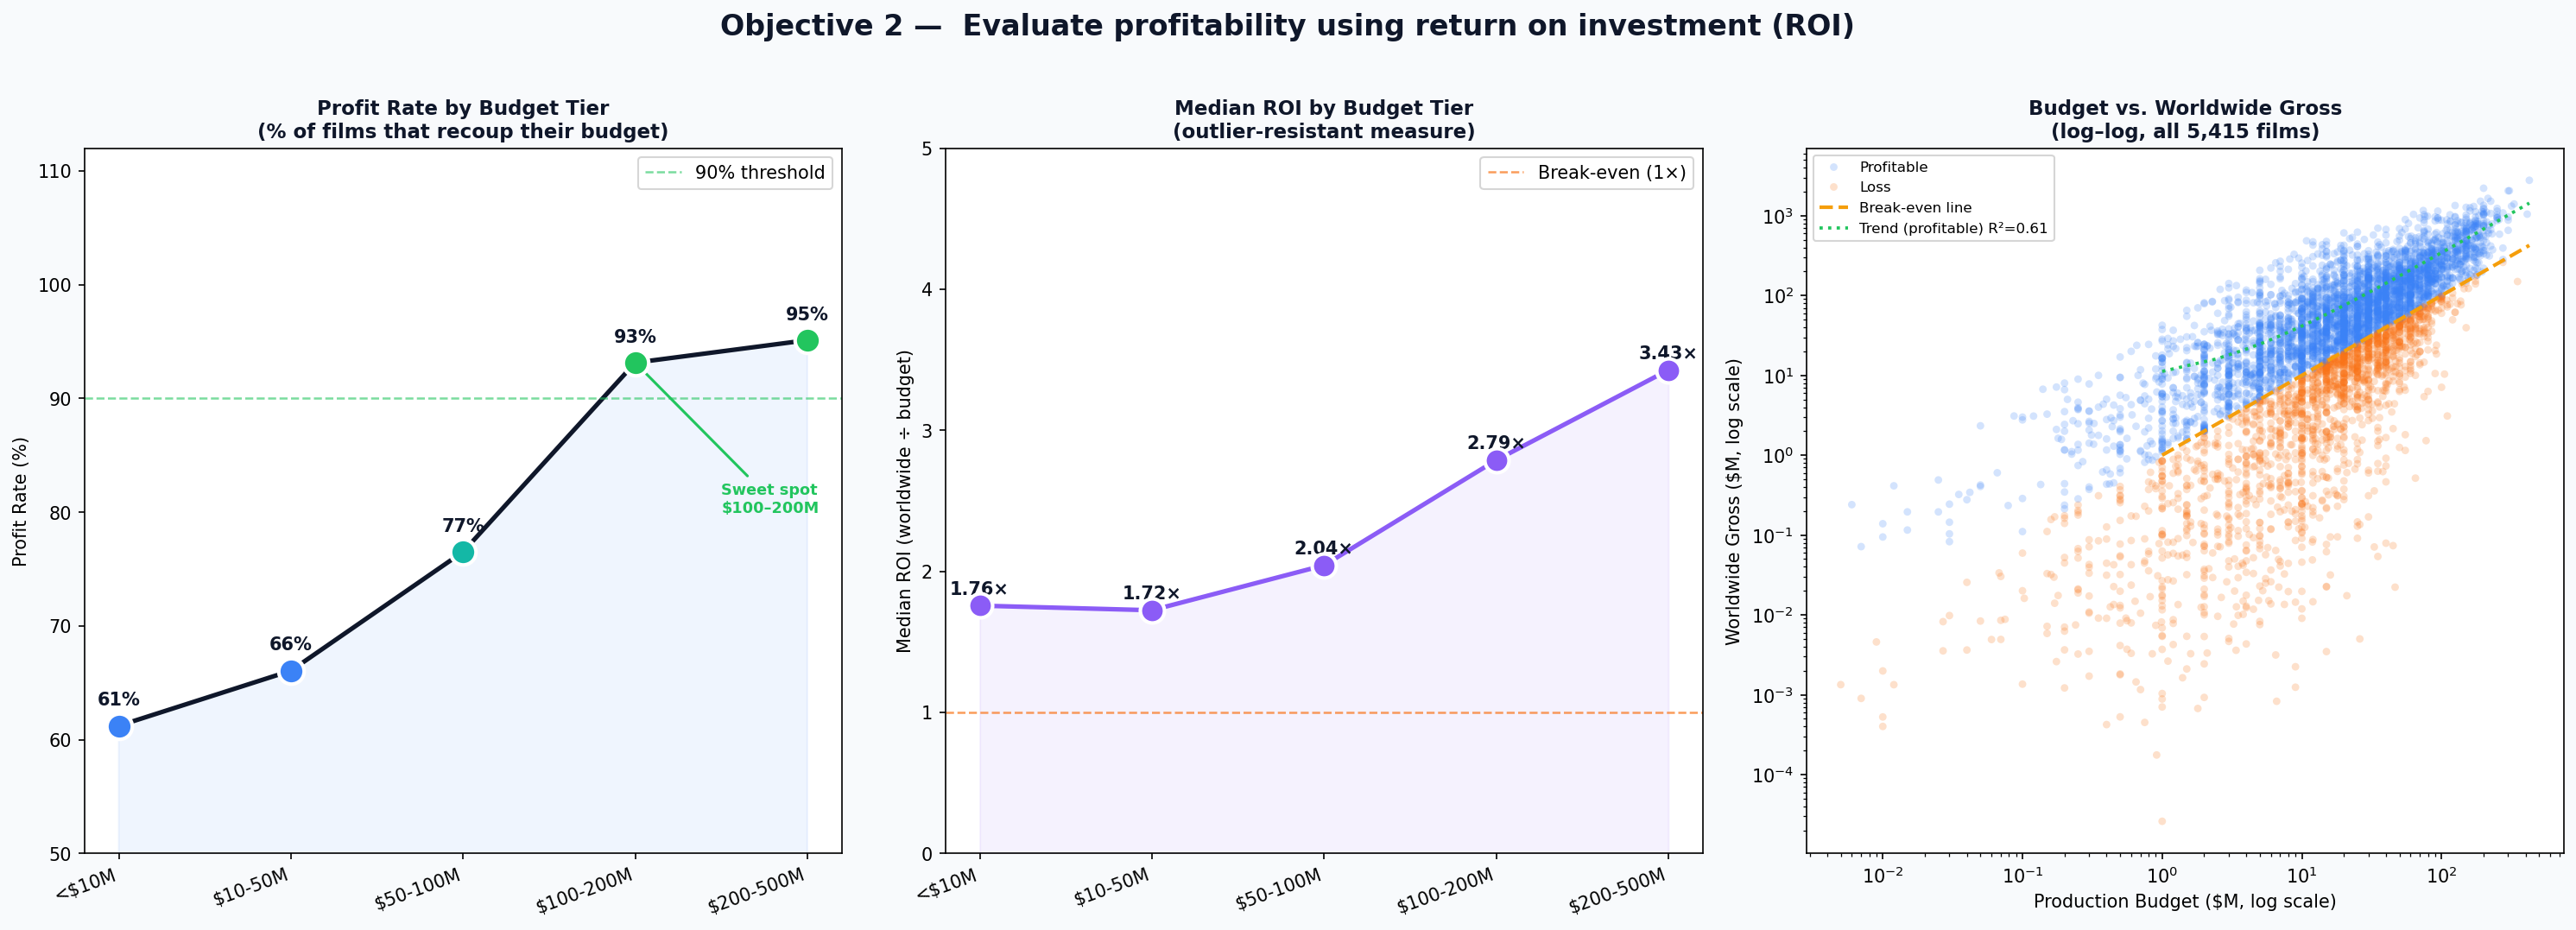
Evaluate profitability across 5 budget tiers using median ROI (robust to outliers) and profit rate. A log-log scatter of all 5,415 films reveals the power-law structure invisible on linear axes.
Key Findings
- $100–200M tier: 93.1% profit rate — 93 in every 100 films recoup their budget theatrically
- Median ROI of 2.79× — a $150M film earns ~$418M worldwide at the median
- $10–50M range: only 66% profit rate — the worst risk-adjusted tier in the dataset
- $200M+ tier: best absolute numbers but requires established distribution infrastructure
- Log-log scatter confirms power-law structure: bigger budgets cluster near break-even; small films scatter widely below
Code Sample
bins   = [0,10e6,50e6,100e6,200e6,500e6,1e12]
labels = ['<$10M','$10–50M','$50–100M',
          '$100–200M','$200–500M','$500M+']
tn['tier'] = pd.cut(
    tn['production_budget'],
    bins=bins, labels=labels
)

tier_stats = (
    tn.groupby('tier', observed=True)
    .agg(
        median_roi  =('roi',        'median'),
        profit_rate =('profitable', 'mean'  ),
        count       =('roi',        'count' ),
    )
    .reset_index()
)
Key Insight — The optimal strategy is neither to minimise cost nor to maximise scale. The $50–80M efficient middle tier delivers the best balance of profitability and manageable risk for a studio building its first slate.
Critical Reception Impact
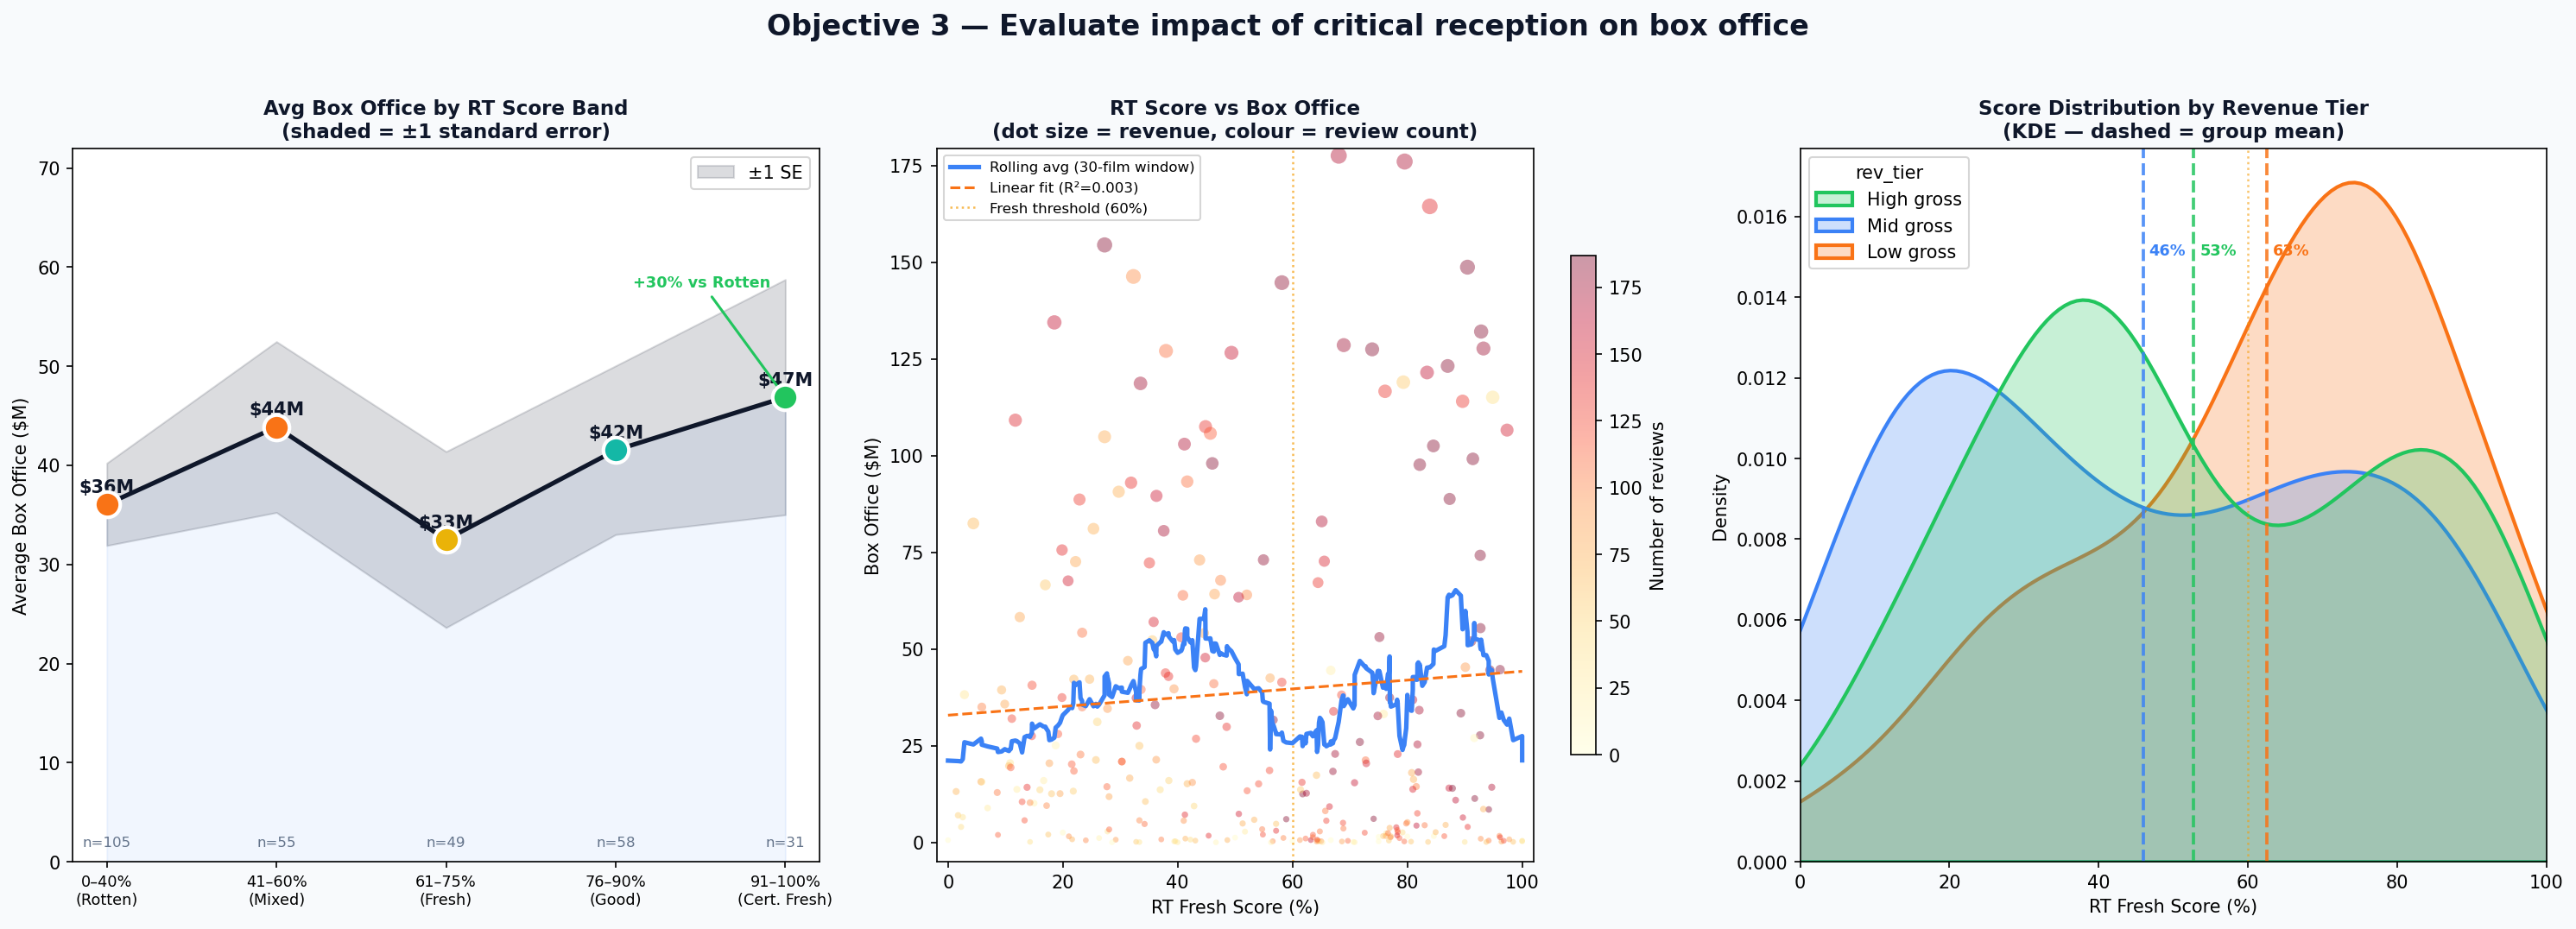
Aggregate RT Reviews to compute fresh_pct per film, merge with RT Info (299 matched films), bin into 5 score bands, and model the revenue impact of critic quality using KDE density curves split by revenue tier.
Key Findings
- Certified Fresh (91–100%) earns +30% more than Rotten (0–40%) films
- The 61–75% band underperforms — prestige / limited-release films with minimal wide distribution
- KDE chart confirms: high-grossing films cluster visibly at higher critic scores
- R² is low — franchise blockbusters earn regardless of reviews, but quality matters for the majority
- 299-film matched sample is directional — the +30% signal is consistent across subsets
Code Sample
fresh_pct = (
    rt_rev
    .groupby('id')['fresh']
    .apply(
        lambda x: (x == 'fresh').mean() * 100
    )
    .rename('fresh_pct')
    .reset_index()
)

merged = rt_genre.merge(
    fresh_pct, on='id', how='inner'
)

bins   = [0, 40, 60, 75, 90, 100]
labels = ['Rotten','Mixed','Fresh',
          'Good','Certified Fresh']
merged['score_band'] = pd.cut(
    merged['fresh_pct'],
    bins=bins, labels=labels
)
Key Insight — Critical reception is a meaningful but not dominant revenue driver. Treat quality as a competitive advantage: invest in it, but pair it with strong genre selection, distribution scale, and audience targeting rather than relying on reviews alone.
Strategic Recommendations
Lead with Sci-Fi, Action & Animation
- Primary genres: Sci-Fi/Fantasy ($80.9M avg), Action/Adventure ($62.3M), Animation ($56.2M)
- Target PG-13 rating for maximum audience breadth ($56.5M avg vs. $23.2M for R-rated)
- Avoid Drama ($28.3M) and Documentary ($11.9M) in the first 3-year slate
- Secondary play: Horror micro-budget ($1–5M) for cash flow and high-ROI diversification
Budget $50–80M per Tent-Pole
- Primary range: $50–80M per tent-pole for optimal risk-adjusted returns
- Expected returns: 2.79× median ROI = $140–225M worldwide at the median
- Micro-budget exception: $1–10M horror films for slate diversification and cash flow
- Avoid the $10–50M range: 66% profit rate — worst risk-adjusted tier in the dataset
Invest in Quality — Target Certified Fresh
- +30% average revenue premium for Certified Fresh vs. Rotten films (+$10.8M)
- Hire directors with strong critical track records for first 3 productions
- Budget $2–5M for script development before any production greenlight
- Delay release rather than cut quality — date flexibility is a competitive advantage
Final Summary
| Objective | Statistic |
|---|---|
| Genre Revenue | $80.9M & $62.3M avg |
| Budget vs ROI | 93.1% profit rate |
| Critical Quality | +$10.8M avg premium |
| Market Trend | $24.5B → $30.9B |
| Studio Benchmark | $417M vs $230M avg |
| MPAA Rating | $56.5M vs $23.2M avg |